
Table of Contents
Restaurant food cost percentage is one of the most closely watched numbers in the industry—but it is also one of the most misunderstood.
For years, restaurant operators were taught that approximately 33% was the industry standard. If food cost exceeded that number, something must be wrong. If it landed near 33%, the restaurant was supposedly operating correctly.
The problem is that restaurants do not all sell the same products, operate under the same model, or generate profit in the same way.
During more than 20 years as an executive chef, general manager, and restaurant owner, I learned that calculating food cost is only the beginning. The real value comes from knowing how to interpret the number, understand why it is too high or too low, and take the right corrective action at the right time.
Your food-cost percentage needs to work for your restaurant—not conform blindly to somebody else’s benchmark.
What Is Restaurant Food Cost Percentage?
Restaurant food cost percentage shows how much of your food revenue was consumed by the cost of the food sold.
The formula is:
Food Cost Percentage = Cost of Goods Sold ÷ Food Sales × 100
Before calculating the percentage, you must determine your cost of goods sold, commonly called COGS.
The formula is:
Beginning Inventory + Food Purchases − Ending Inventory = Cost of Goods Sold
This calculation accounts for the inventory already in the restaurant, the food purchased during the period, and the inventory remaining at the end.
A Basic Food-Cost Example
Suppose a restaurant reports the following figures for a four-week period:
- Beginning food inventory: $12,000
- Food purchases: $28,000
- Ending food inventory: $10,000
- Food sales: $100,000
First, calculate cost of goods sold:
$12,000 + $28,000 − $10,000 = $30,000
Next, divide cost of goods sold by food sales:
$30,000 ÷ $100,000 = 0.30
Multiply the result by 100:
Food Cost Percentage = 30%
The restaurant used 30 cents of food for every dollar of food sales.
That tells us what happened—but it does not tell us whether 30% was good, bad, or appropriate for that particular restaurant.
Why a 33% Food Cost Is Not a Universal Rule
Consider two restaurants:
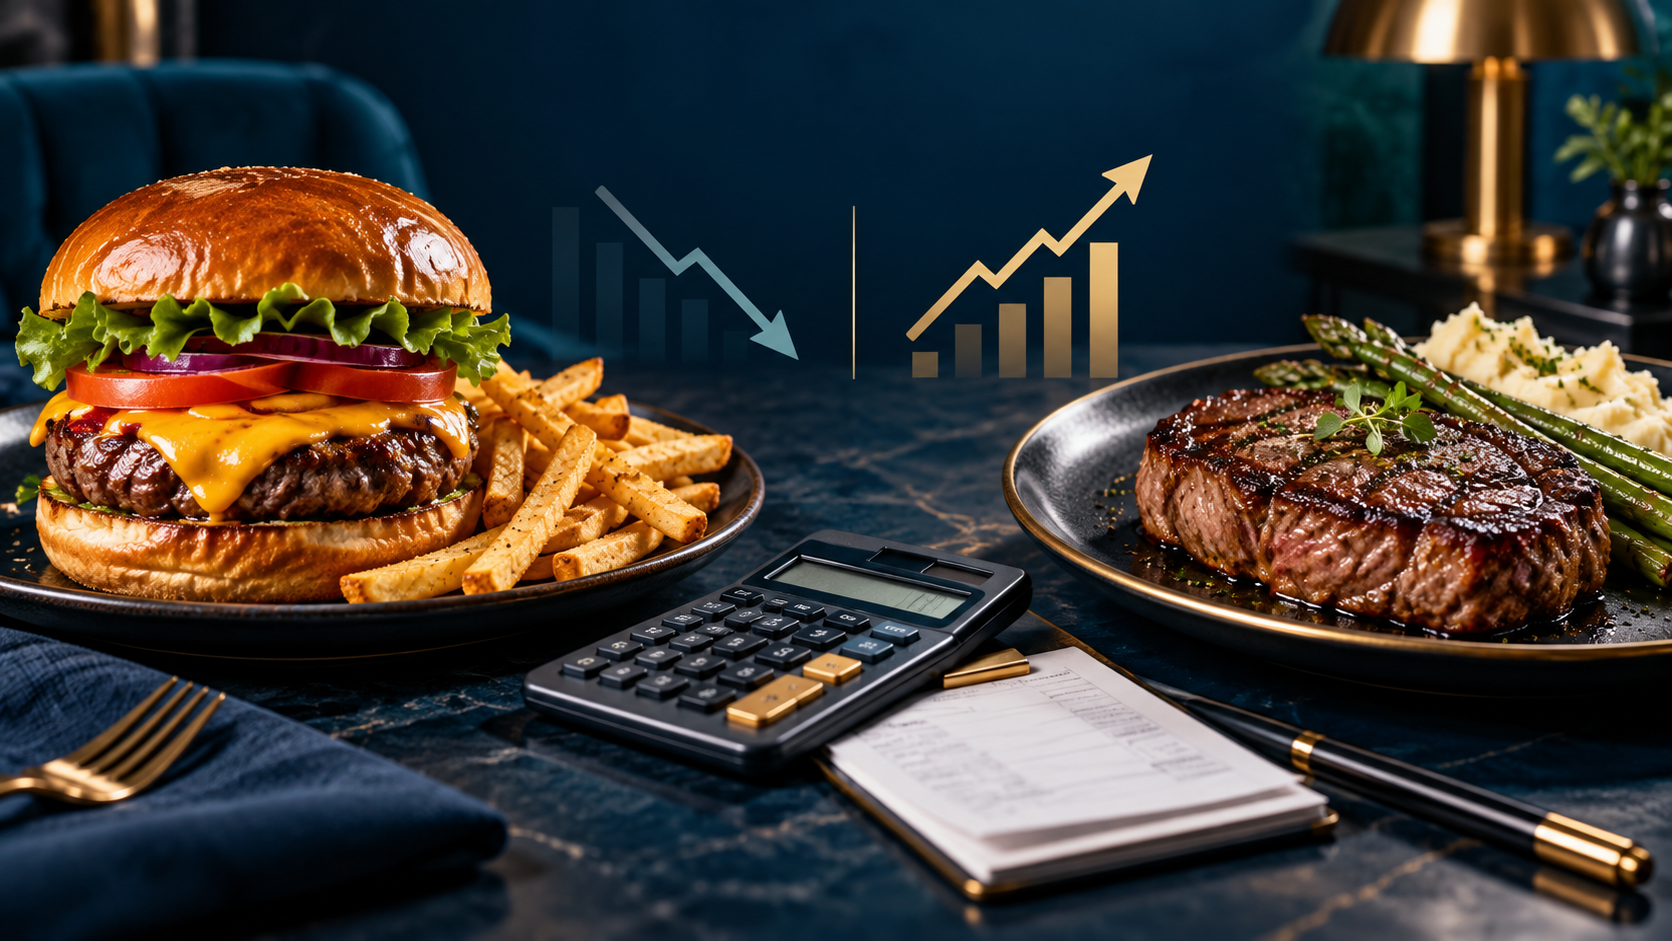
- Restaurant A is a burger restaurant.
- Restaurant B is a steakhouse.
Both restaurants are attempting to price their flagship product according to a 33% food-cost target.
Restaurant A: The Burger
The burger restaurant’s classic cheeseburger includes the ground beef, bun, condiments, and fries.
- Plate cost: $4
- Menu price: $12
- Food cost: approximately 33%
- Plate contribution margin: $8
The $12 selling price also fits the local market. Some competitors charge slightly less, while others charge slightly more. The restaurant is competitively priced and produces an acceptable return from the item.
For this product, the 33% target works.
Restaurant B: The Steak
The steakhouse’s flagship item is an eight-ounce sirloin with a side.
- Plate cost: $18
- Price required for a 33% food cost: approximately $54
- Plate contribution margin at $54: $36
On paper, the percentage looks correct. In the real market, however, the price does not make sense.
Competing restaurants sell comparable sirloins for considerably less. Some may not even charge $54 for a filet, which is generally considered a more premium cut.
The restaurant could achieve its desired percentage—but price the item completely outside its competitive market.
Suppose the steakhouse instead charges $36:
- Plate cost: $18
- Menu price: $36
- Food cost: 50%
- Plate contribution margin: $18
A 50% food cost may initially look alarming. But the steak contributes $18 toward labor, overhead, and profit each time it is sold.
The burger, despite achieving the “ideal” 33% food cost, contributes only $8.
The steak produces more than twice the contribution dollars per sale, even though its food-cost percentage is considerably higher.
This does not automatically mean the entire steakhouse is more profitable. Sales volume, labor, waste, operating expenses, menu mix, and other costs still matter. It does demonstrate why food-cost percentage cannot be the only number used to make pricing decisions.
Percentage Versus Contribution Margin
Food-cost percentage measures the relationship between ingredient cost and selling price.
Plate contribution margin measures the dollars remaining after the food cost is deducted:
Menu Price − Plate Cost = Plate Contribution Margin
Restaurant operators need both measurements.
A low food-cost percentage does not automatically make an item highly profitable. An inexpensive item may deliver a strong percentage but very few actual dollars.
A higher-cost item may have a weaker percentage while contributing substantially more money from every sale.
The better question is not simply:
“What is the food-cost percentage?”
It is:
“Is this item priced appropriately for the market, and does it contribute enough money to support the business?”
That question produces a far more useful answer.
Your Ideal Food Cost Depends on Your Business
There is no universal percentage that fits every restaurant.
The appropriate target depends on factors such as:
- Restaurant concept
- Ingredient costs
- Menu pricing
- Competitive market
- Portion sizes
- Sales volume
- Menu mix
- Labor requirements
- Waste
- Purchasing agreements
- Guest expectations
- Required contribution dollars
A steakhouse, breakfast restaurant, pizza shop, seafood concept, and quick-service restaurant should not be expected to produce identical food-cost percentages.
Even different menu items inside the same restaurant may require different targets.
The restaurant’s overall performance depends on the combined results of everything sold—not whether every item reaches one arbitrary percentage.
Why Menu Mix Matters
A restaurant does not sell equal quantities of every menu item.
Some products have lower food-cost percentages and smaller contribution margins. Others have higher percentages but generate more contribution dollars. The number of times each item sells determines how those products affect the overall business.
This is why menu engineering evaluates both:
- Popularity: How frequently the item sells
- Profitability: How much contribution margin the item generates
A popular item with strong contribution dollars can be extremely valuable even when its food-cost percentage is higher than a traditional benchmark.
Conversely, an item with an excellent food-cost percentage may provide little benefit if customers rarely order it.
The strongest menu is not necessarily the one with the lowest theoretical food cost. It is the one that produces the right combination of guest value, competitive pricing, popularity, and contribution margin.
Actual Versus Theoretical Food Cost
Actual food cost shows what the restaurant really used during a reporting period.
Theoretical food cost estimates what the restaurant should have used based on standardized recipes, current ingredient costs, menu prices, and the number of each item sold.
The difference between the two figures is the food-cost variance.
Suppose a restaurant’s theoretical food cost is 30%, but its actual food cost is 34%. That four-point variance needs to be investigated.
On $100,000 in food sales, four percentage points represent $4,000.
Possible causes include:
- Overportioning
- Unrecorded waste
- Poorly executed preperation
- Inventory-counting errors
- Incorrect recipe costs – This is a big one
- Complimentary food
- Incorrect point-of-sale buttons
- Unrecorded transfers
- Receiving shortages
- Theft or product loss
- Failure to follow standardized recipes
The variance identifies a problem, but management must still determine its cause and take corrective action.
How Often Should Food Cost Be Calculated?
Food cost should be calculated consistently enough to identify problems while they can still be corrected.
A monthly report may satisfy accounting requirements, but waiting an entire month can allow waste, pricing mistakes, or portioning problems to continue for too long.
Many restaurants benefit from weekly or four-week inventory periods.
Whatever period you choose, remain consistent with:
- Inventory timing
- Product categories
- Units of measure
- Item costs
- Invoice dates
- Sales reporting
- Counting procedures
The number becomes more valuable when it can be compared fairly across multiple periods.
What to Do When Food Cost Changes
Do not immediately blame the kitchen or begin cutting purchases.
Investigate the result in a logical order:
- Verify the inventory count.
Look for missing products, duplicate entries, incorrect costs, and inconsistent units. - Confirm purchases.
Make sure invoices, credits, and transfers were entered in the correct period. - Review vendor-price changes.
Begin with high-cost and high-volume products. - Check recipes and portions.
Compare the documented recipe with what employees are actually preparing and serving. - Examine waste records.
Unrecorded waste becomes unexplained food cost. - Review sales mix.
Increased sales of higher-cost products can move the percentage even when recipes are followed correctly. - Evaluate contribution margin.
Determine whether the items are still producing enough dollars—not merely whether they meet a percentage target. - Assign corrective action.
Give every identified issue an owner, a deadline, and a measurable follow-up.
The goal is not simply to report a number. The goal is to understand what the number is saying and respond intelligently.
Manage Food Cost as a System
Effective food-cost management connects:
- Purchasing
- Receiving
- Inventory
- Recipe costing
- Portion control
- Waste tracking
- Menu pricing
- Sales mix
- Contribution margin
- Management follow-up
When these areas operate independently, managers are left chasing unexplained percentages. When they function as one system, the restaurant can identify problems earlier and make better decisions.
That is the principle behind Atlas Digital Publishing:
The number should lead to an explanation, and the explanation should lead to an executable action.
Calculate and Interpret Your Restaurant’s Food Cost
The Atlas Restaurant Calculator Suite includes practical tools designed to help restaurant operators calculate food cost, evaluate performance, and turn everyday operating numbers into better management decisions.
Explore the Restaurant Calculator Suite
A calculator can give you the number. Knowing how to interpret it is what helps you improve the business.
© Atlas Digital Publishing — Complexity, Made Executable.
By Anthony Misuraca | Restaurant Operations Executive & Executive Chef
About the Author
Anthony Misuraca is a restaurant operations professional with more than 22 years of experience as an owner, general manager, executive chef, and director of operations. He has led multimillion-dollar restaurant operations, developed menu-engineering and cost-control systems, trained teams of more than 100 employees, and helped restaurants improve profitability through better purchasing, inventory, labor, and operational controls.
Anthony is also a Certified Bourbon Steward and the founder of Atlas Digital Publishing, where he creates practical calculators, management systems, spreadsheets, and educational resources for restaurant operators.
Leave a Reply